My research focuses on the use of computational simulations to reveal the connection between biomolecular structure and function. We primarily employ molecular dynamics (MD) simulations, which use approximations from classical physics to reduce computational burden, in order to simulate systems with many thousands of atoms over time periods of nanoseconds to milliseconds. Ultimately, we hope to use these simulations to deepen our understanding of biochemical systems and to advance efforts in drug development, enzyme design, and a variety of bioengineering applications. The following is a brief description of some of the projects I’ve been working on.————————- |
|
An interactive Jmol applet depicting the NMR conformation of the HCV IRES subdomain IIa in complex with an inhibitor. (PDB 2KU0) |
|
An interactive Jmol applet depicting the X-ray conformation of the HCV IRES subdomain IIa in complex with an inhibitor. (PDB 3TZR) |
Reliable Force Field Evaluation using R-REMDSome experimentally determined RNA structures are observed to deviate from the native conformation in MD simulations despite ample evidence to suggest that the experimental conformation is preferred. In these cases, it is reasonable to suspect that force field artifacts are responsible for the deviation. Unfortunately, it can be difficult to determine whether a simulation is transiently exploring a non-native conformation (as would occasionally be expected) or whether the force field has disrupted the energy landscape in such a way as to disfavor the native conformation. To determine this, a traditional MD simulation would need to be very long (likely milliseconds) in order to sufficiently explore conformational space. Even using modern supercomputers, such simulations would take many months or years. |
Hepatitis C Virus IRESThe hepatitis C virus (HCV) bypasses the traditional eukaryotic translation initiation pathway by directly binding to the ribosome using its internal ribosome entry site (IRES) domain. The conformation of this domain appears to be critical for the binding process and inhibitors are known to prevent viral replication by disrupting the IRES conformation. Two experimental structures of the IRES subdomain IIa in complex with an inhibitor have been published: one using NMR and one using X-ray crystallography. The binding region of the two structures is distinctly different. Using MD simulations, we observed that the NMR conformation is much less stable than the X-ray conformation. Additionally, we found that MM-GBSA/MM-PBSA free energy techniques poorly reproduced the reported binding free energies. In contrast, the use of explicit solvent potential energies from simulations of both the free and bound inhibitor improves the relative trend in binding energy. We anticipate these results will aid in the future development of inhibitors targeting the HCV IRES.————————- |
|
A variety of algorithms have been developed which speed up this process. We have employed the reservoir replica exchange MD (R-REMD) algorithm, which takes advantage of the fact that conformational transitions occur quicker at higher temperatures, to study a tetranucleotide RNA with the sequence rGACC. This RNA sequence primarily adopts an A-form conformation in solution, as determined by NMR. Due to infrequent conformational transitions in the traditional MD simulation, it is difficult to perform a quantitative assessment of the force field. However, using the R-REMD algorithm, frequent transitions between the various conformational sub-states are observed and the relative populations can be quantitatively reported. |
|
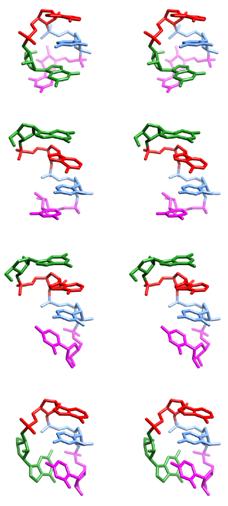
Stereoviews of the four major conformations of the rGACC tetranucleotide observed in simulation. The top and bottom structures are non-A-form and are not expected to predominate in solution. |
|
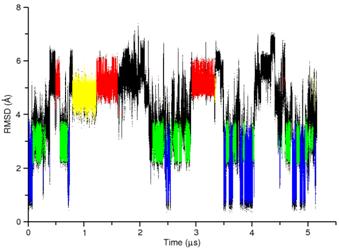
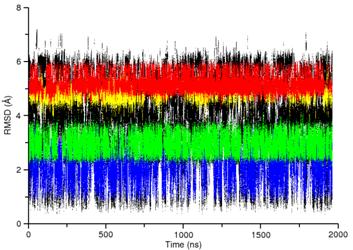
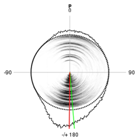
A comparison of RMSD for traditional MD (left) and R-REMD (right) reveals that conformational sampling is enhanced using R-REMD. The four colors (red, yellow, green, and blue) correspond to distinct conformational states of rGACC identified using clustering. ————————- |
|
Using the R-REMD method, we observed that non-A-form structures are oversampled by the current AMBER force field. We are now expanding these results using different water models, salt concentrations, and force field variants. |
|
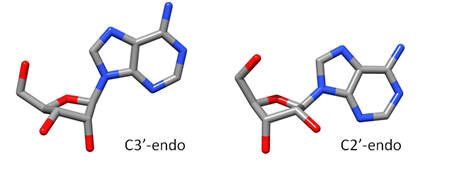
Sugar Pucker Torsion Refinements Once we have reliable data that suggests the force field incorrectly models an RNA conformation, the next task is to determine which force field parameter is at fault. This is very difficult, but most recent force field revisions involve alterations to dihedral parameters. We have observed that in a number of RNA simulations (including rGACC discussed above) the ribose sugar rings in non-helical regions often populate incorrect conformations. The sugar ring conformation, often called sugar pucker, typically occupies either the C3’-endo or C2’-endo configuration. However, in order to properly model RNA structure, the entire set of pucker conformations (known as the pseudorotation cycle) must be accurately modeled. |
|
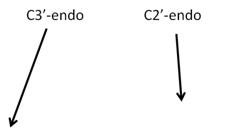
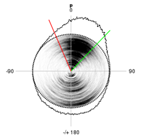
The ribose sugar ring in RNA is typically found in one of two pucker conformations: C3’-endo (left) or C2’-endo (middle). Although these two conformations are the most energetically favored, the entire set of pucker conformations can be described using the pseudorotation cycle (right). |
|
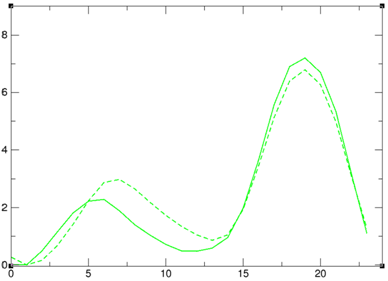
To evaluate the force field, we determined the energetic profile of the entire pseudorotation cycle for all four RNA nucleosides using both the force field and highly accurate quantum mechanical (QM) methods. Significant deviations between the force field and QM results were observed for all of the nucleosides. Re-parameterization of the sugar ring dihedral terms in the force field led to a noticeable shift in the sugar pucker populations of individual nucleosides. We are now in the process of testing whether the new parameters improve simulation results of larger RNAs. |
|
A comparison of the pseudorotation energy profile for guanosine using QM and MM (ie force field) methods (left). Re-parameterizing the dihedral terms to better fit the QM data led to a noticeable shift in the sugar pucker distribution (right, original force field at top, re-parameterized force field at bottom). ————————- |