 |
 |
 |
| My High School photo | Me and our class visiting Campbell Scientific (manufacturer of weather instruments) in Logan, Utah. | |
 You the mouse, Mickey!
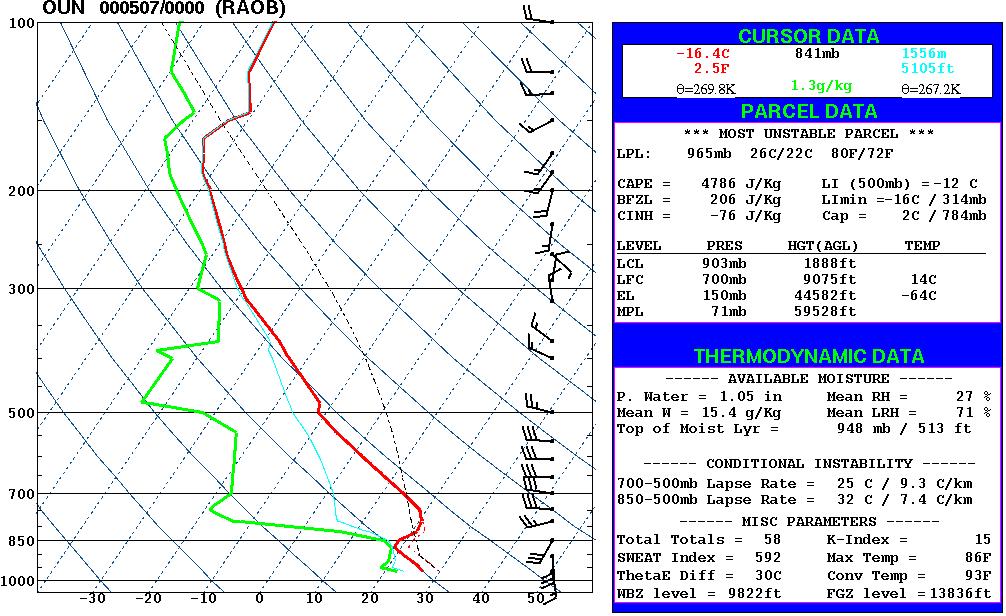
This is a skew-T/log p diagram. The horizontal axis is temperature measured
in degrees Celsius and the vertical axis is pressure measured in millibars
or hectoPascals. Note that the vertical axis is inverted and decreases exponentially.
This is representative of the atmosphere where the highest pressure is at
the surface and the pressure decreases exponentially with height. Also note
that the lines of constant temperature do not run vertically, but rather are
skewed to the right, hence the diagram is called a skew-T/log p diagram.
The plots are generated from the data sent back from a weather balloon as it ascends through the atmosphere. At regular intervals of time, the instrument pack attached to the balloon reports the pressure level, the temperature, and the relative humidity. From a GPS sensor, we can determine the wind direction and speed by observing the balloon's trajectory.
The plots help meteorologists see what layers of the atmosphere are relatively cool or warm, moist or dry.
This particluar image is very exciting because the atmosphere is very unstable above the 700 mb level. That means that a parcel of air lifted from the surface becomes positively buoyant above that level and it will rise unaided until the 150 mb level. Although severe weather is not eminent in the current situation, any feature that causes lift will likely trigger severe thunderstorms to form.
This is a graphic of 24 hour rainfall totals during a heavy rain event last
winter. Rain had been falling prior to this period,though. Flooding was experienced
during this period. A severe thunderstorm caused damage overnight the following
night in the Los Angeles basin. The observation at Acton is wrong.
Here in Salt Lake City, we had a severe thunderstorm on Thursday May 25, 2000.
The storm dumped over two inches of rain in the Sugarhouse area and may have
produced a weak FO tornado in the Holladay area. Many debate that the feature
was not a tornado, but simply a brief amplification of vorticity found naturally
at the gust front of a strong thunderstorm. Note the 70 dbz return over the
sugarhouse area.
Here is the velocity radar image for
the same time. There is a maximum of gate to gate shear over the Holladay area.
Is this our tornado?
This thunderstorm produced one
inch diameter hail in Bountiful. It stripped the leaves off trees.
It's a hawk!