Part 1:
Split into groups of 2-3 students. Using the NCEP reanalysis, each group should generate sea level pressure analyses every 6 h for at least one Alberta and one Colorado cyclogenesis event from the lists below. Each group needs to select a different case.
-
Alberta Cyclones
- 0000 UTC 20 Dec 1972
- 1200 UTC 2 Jan 1973
- 1200 UTC 13 Jan 1974
- 0000 UTC 22 Dec 1974
- 1200 UTC 3 Dec 1975
- 0000 UTC 27 Dec 1976
- 1200 UTC 5 Feb 1979
- 1200 UTC 14 Dec 1979
- 1200 UTC 13 Jan 1980
- 1200 UTC 4 Dec 1982
- 1200 UTC 13 Jan 1983
- 1200 UTC 12 Feb 1985
- 0000 UTC 24 Jan 1986
- 1200 UTC 4 Mar 1986
- 1200 UTC 8 Mar 1986
- 1200 UTC 10 Dec 1987
- 1200 UTC 15 Feb 1988
- 1200 UTC 27 Mar 1988
- 1200 UTC 17 Jan 1989
Colorado Cyclones
- 0000 UTC 21 Mar 1981
- 0000 UTC 28 Mar 1981
- 0000 UTC 14 Dec 1982
- 1200 UTC 24 Dec 1982
- 0000 UTC 18 Feb 1984
- 1200 UTC 18 Mar 1984
- 1200 UTC 15 Jan 1985
- 1200 UTC 3 Mar 1985
- 0000 UTC 14 Feb 1986
- 1200 UTC 23 Jan 1988
- 0000 UTC 14 Feb 1988
- 1200 UTC 7 Mar 1988
- 1200 UTC 26 Dec 1988
- 1200 UTC 5 Jan 1989
- 0000 UTC 11 Jan 1989
- 0000 UTC 5 Feb 1989
- 0000 UTC 3 Mar 1989
- 1200 UTC 17 Mar 1989
- 00000 UTC 20 Mar 1989
- The plot region should extend from 160W to 80W and 25N to 70N
- Set both plot times to the time you desire (otherwise you'll receive a time-averaged plot)
- Set the contour interval to 2 mb
- Specify GIF for the output type
- Once the plot has been generated, click and hold down the right mouse button in the image, drag down to save image as and save the image to disk. Then you can use xanim to loop and examine the images.
- You will need to determine how long of a period prior to and following each event that you need to examine.
Part 2:
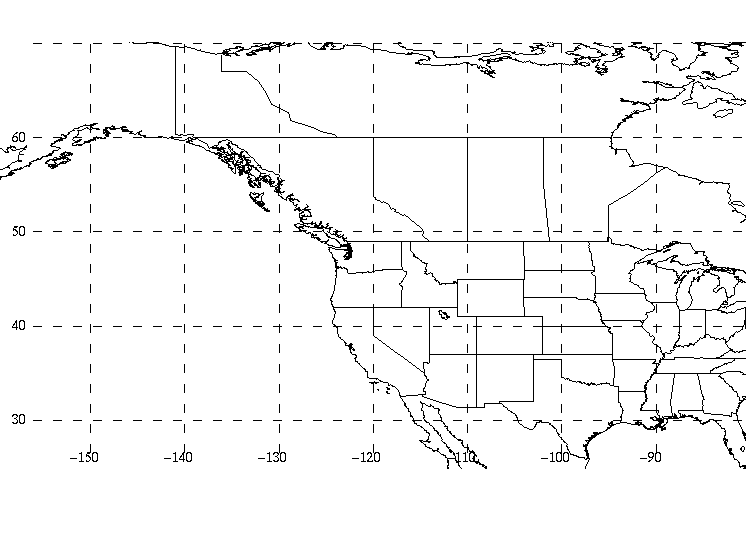
Print out the map at the bottom of this web page. For each event,
plot the position of the cyclone every 6-h on the map. Summarize how
the storm track and motion are affected by the Rockies. Consider
the following questions for your summary:
- How do the tracks of the cyclones evolve as they approach, traverse, and move downstream of the Rocky Mountains?
- Is there a continuous or discontinuous progression of the cyclones across the Rockies?
- How might non-orographic processes be influencing the storm tracks? (to answer this question, you may want to examine the large-scale flow evolution using the NCEP reanalysis)
Create a graph (either using the computer or graph paper) of each cyclones' central pressure vs. time. Then, describe how the Rockies impact the growth rate. Consider the following questions for your description:
- What is the growth rate windward, over, and leeward of the Rockies?
- In what region does the most rapid deepening occur?
- How might the orography be impacting this rapid deepening?
- How might non-orographic processes be influencing the deepening rate (examine the large-scale flow evolution using the NCEP reanalysis).