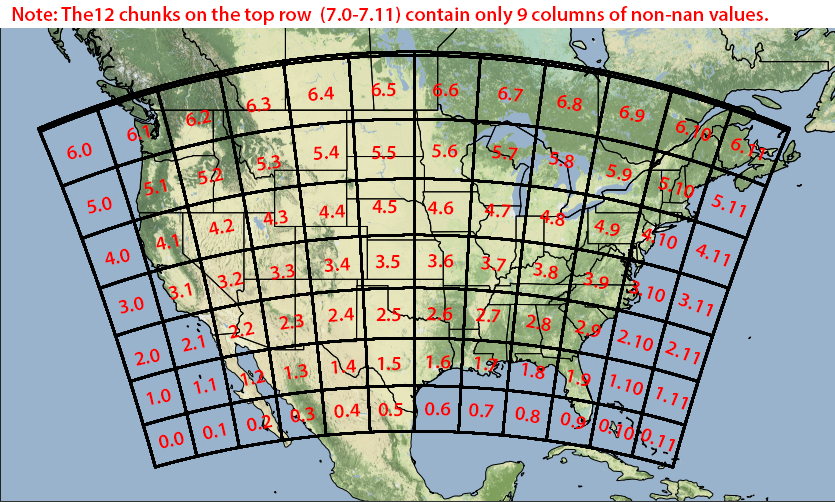
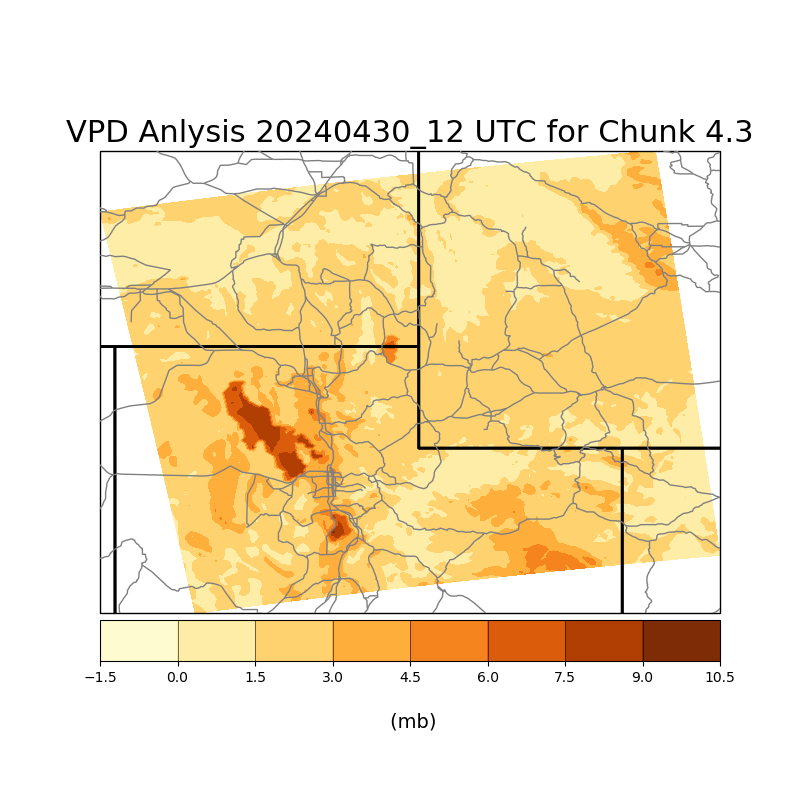
The HRRR Conus data is split up into 96 chunks that are 150x150 grids. To try out this super cool data set, select the variable from the drop down menu and click the chunk ID on the map to view the appropriate graphic.


Chunk_ID_Map 0.00.10.20.30.40.50.60.70.80.90.100.11 1.01.11.21.31.41.51.61.71.81.91.101.11 2.02.12.22.32.42.52.62.72.82.92.102.11 3.03.13.23.33.43.53.63.73.83.93.103.11 4.04.14.24.34.44.54.64.74.84.94.104.11 5.05.15.25.35.45.55.65.75.85.95.105.11 6.06.16.26.36.46.56.66.76.86.96.106.11 7.07.17.27.37.47.57.67.77.87.97.107.11

These graphics were derived from records archived by the University of Utah.