Objectives for Research
- Understand the sensitivity of Eta model forecasts to horizontal and vertical model resolution
- Determine how well a high resolution numerical mesoscale model (10 km/60 layer) forecasts mesoscale features in the complex terrain of the western United States
Outline
- Compare Observed 24 Hour Precipitation ending at 1200 UTC with forecasted precipitation from 48, 29, and 10 km versions of the Eta model
- Period of study extends from 02 January 1997 to 22 August 1997
- Total of 194 cases
- Compare Observed Surface Winds in Wasatch Front downslope windstorm case with low-level winds predicted by 48, 29, and 10 km versions of the Eta model as well a 6 km MM5 run
- Downslope windstorm case of 24 February 1997
- Observed surface winds from Utah Mesonet
- Eta low-level winds are derived from the lowest eta level wind in the model
Conclusions
- Precipitation Comparison
- Equitable threat scores for winter 1997 show the 10 km MesoEta performing better than the 29 km MesoEta and 48 km Eta for almost all amounts
- Scores for spring and summer 1997 show the 10 km MesoEta performing better for amounts greater than 1.00 inch but performing worse for amounts less than 1.00 inch
- The 10 km MesoEta has proven to be a valuable tool at forecasting better precipitation amounts and distributions, but a problem in the convection schemes in the Eta models, which is especially apparent in the 10 km MesoEta, produces too much precipitation in convective situations (a more detailed observed precipitation data set would show this conclusion/observation)
- Downslope Windstorm
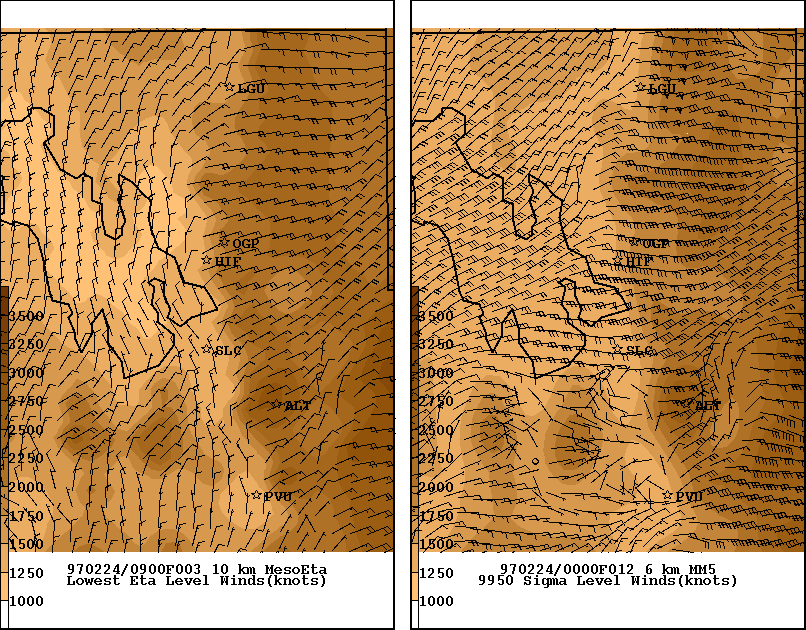
- All versions of the Eta model performed poorly at forecasting the magnitude of the near-surface winds at crest level and in the foothills at the base of the slope, whereas the 6 km MM5 run forecast well the speed of these winds
- The 6 km MM5 run spreads the high winds too far to the west while the 10 km MesoEta decelerates the winds close to the base of the Wasatch Front as is typically observed
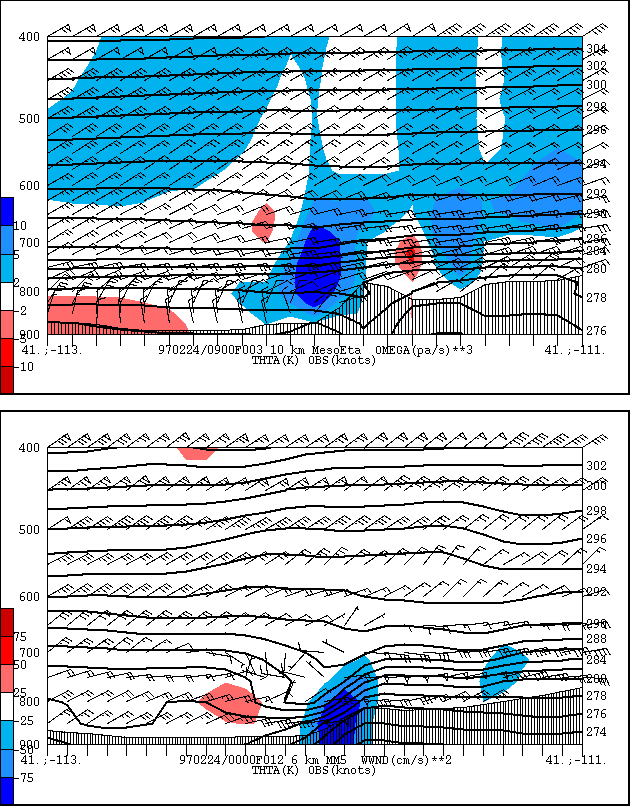
- The 6 km MM5 run produces a mountain wave as is indicated in the cross-sections by the theta and vertical velocity fields. The 10 km MesoEta theta field does not indicate a mountain wave, though the vertical velocity field shows significant structure.
PRECIPITATION COMPARISON
Observed Precipitation
- Data Sources
- National Weather Service (NWS) State Temperature and Precipitation Summaries (STPs)
- Archived STPs from Western Region Climate Center (WRCC)
- Selected because of data coverage, reliability, & quality
- Different sources of precipitation data that are being explored/considered
- RAWS & SNOTEL Sites - considered as lesser quality, but would fill data sparse regions (from the NWS STPs)
- RFC data via NCEP
- Station data
- 4 km & 15 km grids
- RFC data combined with WSR-88D precipitation estimates via NCEP
- Station data
- 4 km & 15 km grids
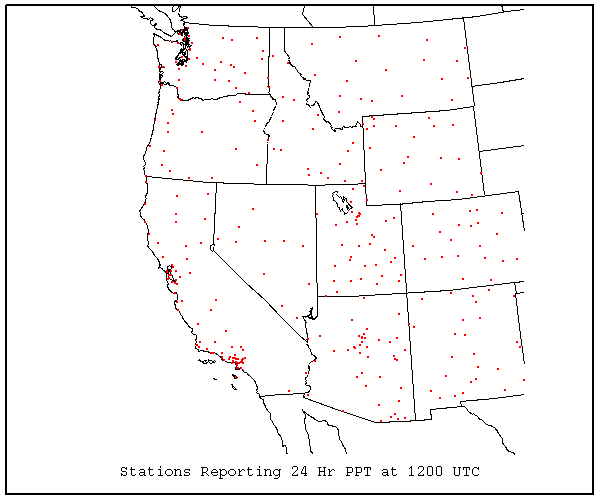
- Over 500 stations available in 11 western states
- Typically, only 250 - 150 stations reporting at 1200 UTC, with a range of 280 to 79 at any one time
- No data available at 1200 UTC 22 February 1997
- Beginning 27 June 1997, when the 10 km MesoEta West Nest domain was changed, the verification area became smaller than previous to include the states of California, Nevada, Utah, & Arizona with parts of Oregon, Idaho, Wyoming, Colorado, & New Mexico also being included.
- Precipitation data stored in GEMPAK surface files
Stations Reporting 24 Hr PPT at 1200 UTC
Stations from Los Angeles NWSFO did not report at 1200 UTC until June 1997
Example: 1200 UTC 23 April 1997 - 1200 UTC 24 April 1997
TOP: 24 Hr PPT * 100 displayed by numerical value
BOTTOM: 24 Hr PPT displayed by symbol size and color

Eta Model Forecasts
- Models used for the study
- 48 km 'Early' Eta (Eta)
- 29 km Mesoscale Eta (MesoEta)
- 10 km West Nest Mesoscale Eta (West)
- The numerical code for the 10 km MesoEta is similar to the code used in the 29 km MesoEta. Several important differences are noted:
- On 13 March 1997, the depth required for shallow convection was changed from 290 mb to 2000 meters
- Also on 13 March 1997, "The dryness of the reference moisture profiles for the deep convection became tied to the surface elevation so that the higher the land, the drier the profile. That led to more precip being wrung out over elevated terrain . . . " (Tom Black, 1997)
- A different dynamics driver
- "No 'swap' at all in the convection (switching from deep to shallow at a point if the deep failed to make precip due to the column being too dry)" (Tom Black, 1997)
- 3D-Var Analysis (vs. the OI in the 29 km MesoEta)
- Total of 194 cases used for comparison/verification on the model's native horizontal coordinate
- 10 Eta runs on 80 km grid
- 19 MesoEta runs on 40 km grid
- 1 West run on 20 km Grid - 97010209
- Starting times:
- From 02 January 1997 - 26 February 1997, the 10 km West Nest was run starting at 0900 UTC, and 29 km MesoEta runs were also available. The 0000 UTC Eta is used for comparison during this period.
- When a 0900 UTC MesoEta run was not available, a 0300 UTC MesoEta run is Used.
- From 27 February 1997 - 21 August 1997, the 10 km West Nest was run starting at 0300 UTC. The 29 km MesoEta also starting at this time is used. The 0000 UTC Eta is continued to be used For comparison.
- Verification domain:
- From 02 January 1997 - 26 June 1997, the 10 km West Nest domain covered the Western United States.
- From 27 June 1997 - 21 August 1997, the 10 km West Nest domain was reduced to the Southwestern United States to make computer resources at NCEP available for testing of the new 32 km MesoEta.
Example: 24 Hr Period Ending at 1200 UTC 24 April 1997


- 48 km Early Eta Model Analyses & Forecasts
Observed and Forecast Precipitation Archive
- The previous graphics showing observed precipitation (amounts & symbols) and forecast precipitation are available for the entire period of study via the 10 km West Nest Case Studies Web page.
- A great seal of graphics are available, from one to two panel displays of observed and forecast precipitation. Simply
- Enter the verification sate in the window box
- Select one panel or two panel (amounts or symbols)
- Select the version of the Eta model or observed precipitation
- Click on the Submit button
Verification Statistics
- Verification statistics are shown and displayed here for the three seasons in which the study encompasses:
- Winter 1997 (January - March) - 68 cases
- Spring 1997 (April - June) - 80 cases
- Summer 1997 (July - August) - 46 cases
- Several statistical scores are computed via two methods:
- Station Point Method (PT)
- This method involves bilinear interpolation of the gridded model output to the individual station locations to compare the forecast with the observed
- Advantages/Disadvantages
- A: Provides a direct coorelation between the precipitation observed at a specific site and the forecasted precipitation from the model.
- D: Tends to place favor in regions of denser observations
- Grid Point Method (GD)
- This method averages precipitation observations in a grid box around a grid point to compare the forecast with the observed
- Advantages/Disadvantages
- A: Since model output at a grid point has been defined as an area-averaged forecast precipitation, area-averaged observed precipitation means comparison of similar values
- D: Averaging the observed precipitation in a grid box takes away 'peaks'
- D: Depending on the horizontal grid resolution, mesoscale features in the observed precipitation are discounted
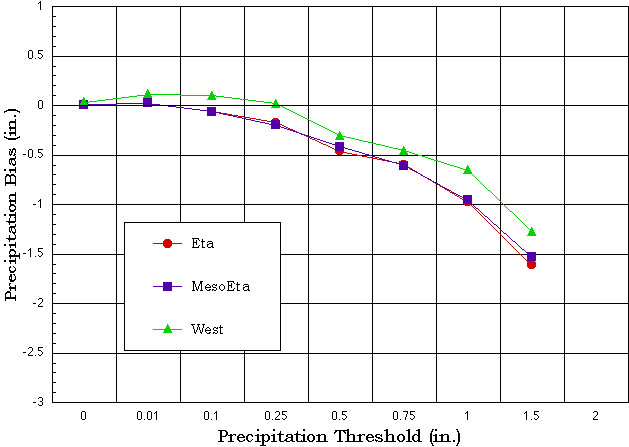
- BIAS
- We define the bias as (forecast - observed) (not forecast/observed as is sometimes used), sum over the number of observation/forecast pairs, and divide by the total number of observation/forecast pairs in each particular precipitaion threshold bin
- Bias thus relates the average error (in inches) of the forecast, with a perfect score being 0.0
- Over-forecasting results in positive bias and under-forecasting results in negative bias
- As individual scores are averaged, cancelation may occur and the bias score inaccurately shows high skill
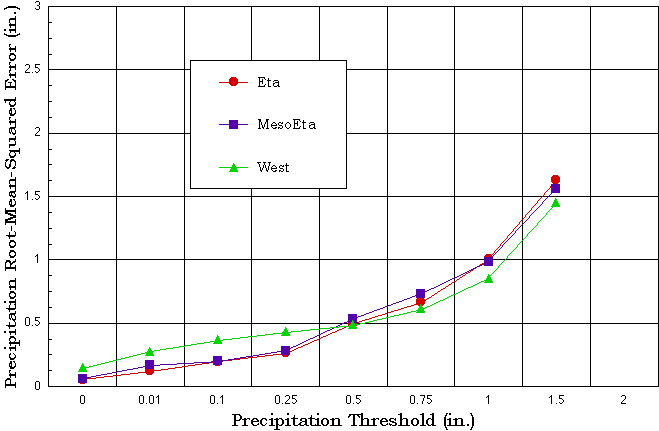
- Root-Mean Squared Error (RMS)
- RMS is (forecast - observed)**2, sum over the number of observation/forecast pairs, divide by the total number of observation/forecast pairs, and take the square-root in each particular precipitaion threshold bin
- RMS is similar to bias in that it relates the average error (in inches) of the forecast with a perfect score being 0.0
- As a squared error, all values are positive and no cancelation occurs
- Large errors may tend to cause the score to be an over-estimate
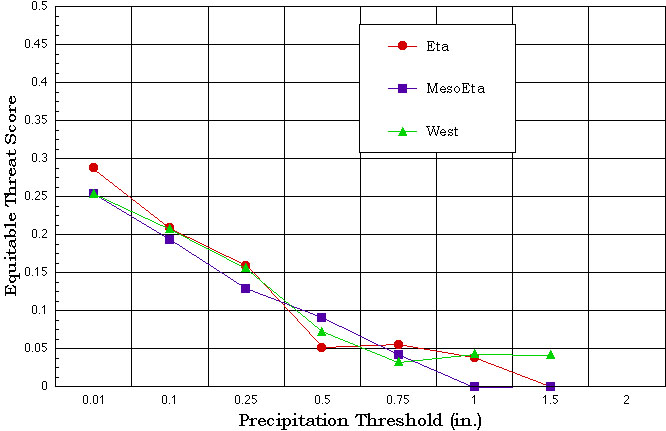
- Equitable Threat Score (ETS)
- ETS is defined as (H - C)/(F + O - H - C); where H = Hits, C = Chance, F = Forecast, and O = Observed
- ETS aelates the ability of the model to forecast a value in the same precipitation threshold bin as the observed or greater
- ETS is not defined for the 0.0 PPT threshold bin
- A perfect ETS is 1.0
- ETS may tend to favor over-prediction
CORRECTION
On September 24, 1997, an error was detected in the comparison program for the PT method. It has been corrected and the following are the statistics as they should be.
Table of Statistics - Winter 1997
| 14018 |
10898 |
1534 |
753 |
461 |
178 |
82 |
71 |
23 |
18 |
10 km West Nest
| THRPPT |
0.00 |
0.01 |
0.10 |
0.25 |
0.50 |
0.75 |
1.00 |
1.50 |
2.00 |
| BIAS |
0.0292 |
0.1034 |
0.1065 |
0.1117 |
0.0975 |
-0.1277 |
-0.1500 |
-0.4053 |
-1.2944 |
| RMS |
0.1043 |
0.2237 |
0.2938 |
0.3851 |
0.5251 |
0.5831 |
0.6466 |
0.8124 |
1.5320 |
| ETS |
|
0.3238 |
0.3306 |
0.3380 |
0.2923 |
0.2325 |
0.2039 |
0.2103 |
0.2966 |
29 km MesoEta
| THRPPT |
0.00 |
0.01 |
0.10 |
0.25 |
0.50 |
0.75 |
1.00 |
1.50 |
2.00 |
| BIAS |
0.0310 |
0.1075 |
0.1100 |
0.0897 |
0.0371 |
-0.1722 |
-0.2719 |
-0.5315 |
-1.0014 |
| RMS |
0.1007 |
0.2258 |
0.2957 |
0.3651 |
0.5352 |
0.6014 |
0.6777 |
0.8148 |
1.6262 |
| ETS |
|
0.3136 |
0.3144 |
0.3197 |
0.2808 |
0.2314 |
0.2048 |
0.1716 |
0.1897 |
48 km Eta
| THRPPT |
0.00 |
0.01 |
0.10 |
0.25 |
0.50 |
0.75 |
1.00 |
1.50 |
2.00 |
| BIAS |
0.0328 |
0.1304 |
0.1319 |
0.1115 |
0.0636 |
-0.1991 |
-0.1338 |
-0.4926 |
-1.1048 |
| RMS |
0.1029 |
0.2542 |
0.3241 |
0.4001 |
0.5352 |
0.5791 |
0.7376 |
0.7647 |
1.9618 |
| ETS |
|
0.3100 |
0.3115 |
0.3001 |
0.2461 |
0.2045 |
0.2240 |
0.1582 |
0.1624 |
Click Here to see the same tables except for the GD method
Graphs of Statistics - Winter 1997
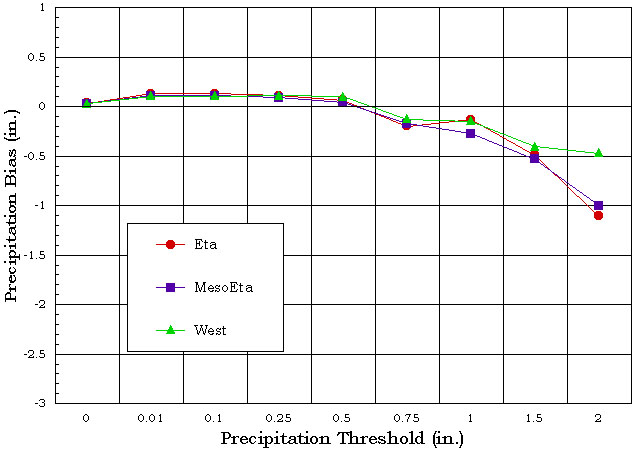
PRECIPITATION BIAS
(Forecast - Observed)
24 Hr Totals - Winter 1997
PT Method
 Click Here to see the same graph except for the GD method
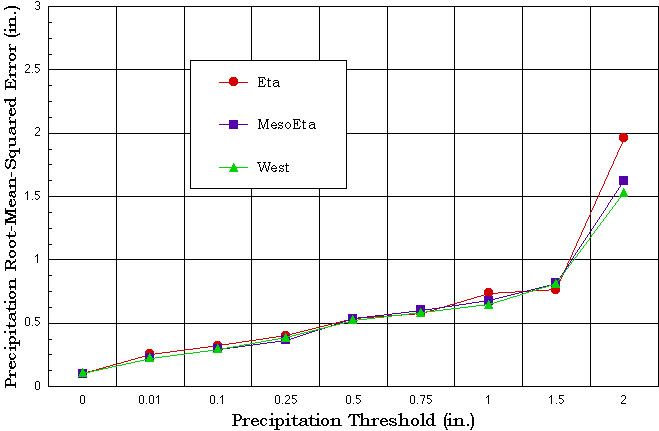
PRECIPITATION RMS
24 Hr Totals - Winter 1997
PT Method
 Click Here to see the same graph except for the GD method
PRECIPITATION ETS
24 Hr Totals - Winter 1997
PT Method
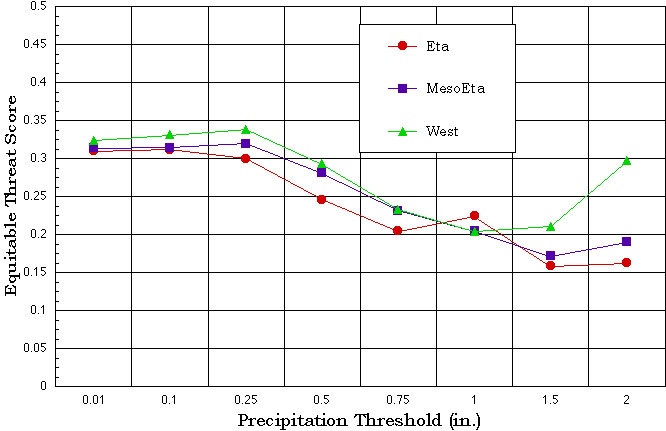 Click Here to see the same graph except for the GD method
Table of Statistics - Spring 1997
| 18474 |
14765 |
1768 |
1064 |
535 |
210 |
66 |
48 |
11 |
7 |
10 km West Nest
| THRPPT |
0.00 |
0.01 |
0.10 |
0.25 |
0.50 |
0.75 |
1.00 |
1.50 |
2.00 |
| BIAS |
0.0471 |
0.1710 |
0.1607 |
0.0825 |
-0.1135 |
-0.1410 |
-0.4064 |
-1.2416 |
-1.9373 |
| RMS |
0.1566 |
0.3355 |
0.3800 |
0.4246 |
0.4309 |
0.5086 |
1.0430 |
1.2964 |
1.9559 |
| ETS |
|
0.2891 |
0.2434 |
0.1697 |
0.1104 |
0.0662 |
0.0413 |
-0.0008 |
-0.0003 |
29 km MesoEta
| THRPPT |
0.00 |
0.01 |
0.10 |
0.25 |
0.50 |
0.75 |
1.00 |
1.50 |
2.00 |
| BIAS |
0.0264 |
0.1071 |
0.0875 |
-0.0065 |
-0.1745 |
-0.2378 |
-0.5128 |
-1.2707 |
-2.0828 |
| RMS |
0.1030 |
0.2347 |
0.2858 |
0.3298 |
0.4092 |
0.5068 |
0.9184 |
1.3130 |
2.0941 |
| ETA |
|
0.3357 |
0.2950 |
0.2097 |
0.1383 |
0.0946 |
0.0507 |
-0.0006 |
-0.0002 |
48 km Eta
| THRPPT |
0.00 |
0.01 |
0.10 |
0.25 |
0.50 |
0.75 |
1.00 |
1.50 |
2.00 |
| BIAS |
0.0237 |
0.1025 |
0.0619 |
-0.0519 |
-0.2030 |
-0.3286 |
-0.6782 |
-1.3161 |
-2.0750 |
| RMS |
0.0878 |
0.2177 |
0.2375 |
0.2961 |
0.3960 |
0.4881 |
0.8300 |
1.3575 |
2.0905 |
| ETS |
|
0.3401 |
0.2878 |
0.2013 |
0.1461 |
0.0589 |
0.0458 |
-0.0004 |
-0.0001 |
Click Here to see the same tables except for the GD method
Graphs of Statistics - Spring 1997
PRECIPITATION BIAS
(Forecast - Observed)
24 Hr Totals - Spring 1997
PT Method
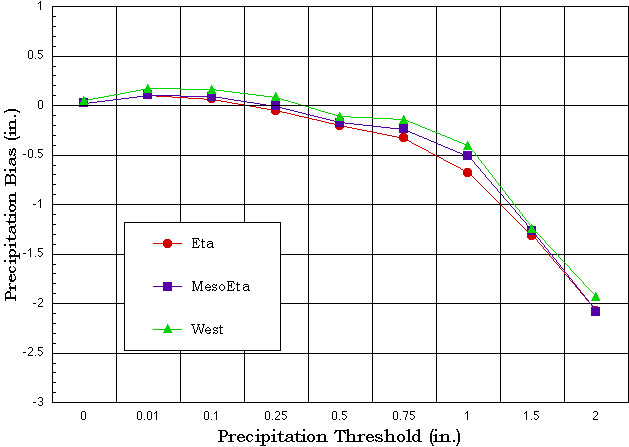 Click Here to see the same graph except for the GD method
PRECIPITATION RMS
24 Hr Totals - Spring 1997
PT Method
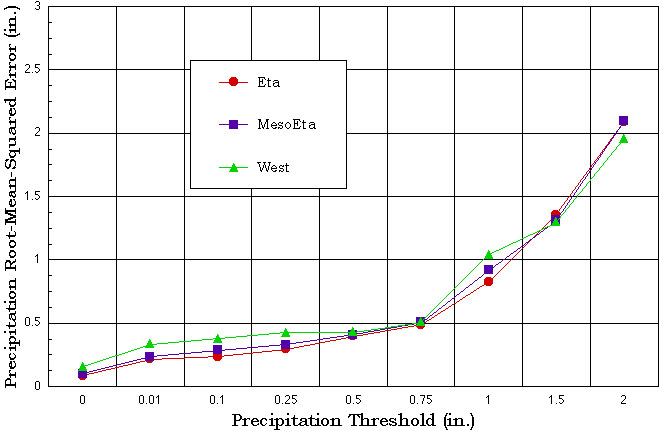 Click Here to see the same graph except for the GD method
PRECIPITATION ETS
24 Hr Totals - Spring 1997
PT Method
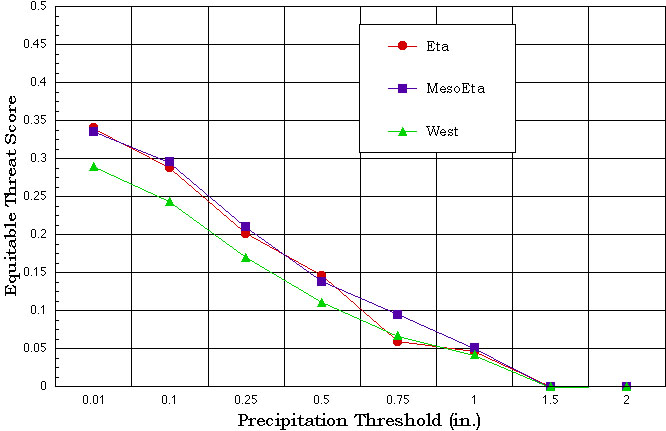 Click Here to see the same graph except for the GD method
Table of Statistics - Summer 1997
| 6807 |
5982 |
377 |
206 |
141 |
58 |
22 |
17 |
4 |
0 |
10 km West Nest
| THRPPT |
0.00 |
0.01 |
0.10 |
0.25 |
0.50 |
0.75 |
1.00 |
1.50 |
2.00 |
| BIAS |
0.0329 |
0.1157 |
0.0994 |
0.0190 |
-0.3020 |
-0.4557 |
-0.6513 |
-1.2761 |
|
| RMS |
0.1450 |
0.2754 |
0.3675 |
0.4278 |
0.4863 |
0.6095 |
0.8517 |
1.4491 |
|
| ETS |
|
0.2541 |
0.2071 |
0.1560 |
0.0725 |
0.0318 |
0.0426 |
0.0412 |
|
29 km MesoEta
| THRPPT |
0.00 |
0.01 |
0.10 |
0.25 |
0.50 |
0.75 |
1.00 |
1.50 |
2.00 |
| BIAS |
0.0103 |
0.0256 |
-0.0610 |
-0.1980 |
-0.4167 |
-0.6058 |
-0.9575 |
-1.5303 |
|
| RMS |
0.0614 |
0.1689 |
0.2021 |
0.2853 |
0.5378 |
0.7327 |
0.9842 |
1.5606 |
|
| ETS |
|
0.2536 |
0.1933 |
0.1289 |
0.0908 |
0.0423 |
-0.0009 |
-0.0003 |
|
48 km Eta
| THRPPT |
0.00 |
0.01 |
0.10 |
0.25 |
0.50 |
0.75 |
1.00 |
1.50 |
2.00 |
| BIAS |
0.0089 |
0.0225 |
-0.0598 |
-0.1736 |
-0.4605 |
-0.5965 |
-0.9747 |
-1.6121 |
|
| RMS |
0.0542 |
0.1206 |
0.1960 |
0.2636 |
0.4980 |
0.6678 |
1.0056 |
1.6306 |
|
| ETS |
|
0.2875 |
0.2083 |
0.1589 |
0.0510 |
0.0551 |
0.0378 |
0.0000 |
|
Click Here to see the same tables except for the GD method
Graphs of Statistics - Summer 1997
PRECIPITATION BIAS
(Forecast - Observed)
24 Hr Totals - Summer 1997
PT Method
 Click Here to see the same graph except for the GD method
PRECIPITATION RMS
24 Hr Totals - Summer 1997
PT Method
 Click Here to see the same graph except for the GD method
PRECIPITATION ETS
24 Hr Totals - Summer 1997
PT Method
 Click Here to see the same graph except for the GD method
Precipitation Statistics Summary
- Winter 1997
- The precipitation bias and RMS error scores indicate that the precipitation forecasts from the three versions of the Eta model were quite similar in their averaged differences from that observed with the 10 km MesoEta being slightly better with amounts in excess of 1.50 inches
- The equitable threat score indicates that the 10 km MesoEta model was more skillful at forecasting precipitation under 0.75 inches and over 1.50 inches
- Utilizing the GD method for precipitation verification, the 10 km MesoEta forecasted amounts 1.50 inches or greater better than the 29 km and 48 km versions (following the bias and ETS graphs), and that it also proved to be more skillful at predicting amounts less than 1.00 inches and over 1.50 inches(ETS graph)
- Spring 1997
- Similar results are seen in the bias and RMS error scores among the three models, except that the 48 km Eta and 29 km MesoEta perform better than the 10 km MesoEta for amounts less than 0.50 inches, and the 10 km MesoEta performs better for amounts over 0.50 inches
- The ETS scores for this period also indicate the above conclusion as well as showing the 48 km Eta performing better than the 29 km MesoEta at amounts less than 0.50 inches and the 10 km MesoEta being less skillful at amounts up to 1.50 inches
- The GD method scores (bias, RMS, & ETS) indicate the same conclusions
- Summer 1997
- The bias scores for this period show that the 10 km MesoEta on average more accurately forecasted PPT amounts greater than 0.10 inches
- The RMS error scores indicate that the 10 km forecasted worse at amounts less than 0.50 inches but forecasted better at amounts more than 0.75 inches
- The ETS also show that the 10 km MesoEta is more skillful at forecasting higher PPT amounts ( > 1.00 inches ). Because of the tendency for the 10 km MesoEta to over forecast small to moderate amounts (0.10 to 0.50 inches), higher skill scores are shown in this range
- The GD method scores (bias, RMS, & ETS) also show similar results except that the ETS is relatively the same among the three models
- Overall
- In the winter of 1997, the 10 km MesoEta forecasted more skillfully than the 29 km MesoEta and the 48 km Eta for precipitation amounts less than one inch dn greater than 1.50 inches
- In the spring and summer of 1997, the 48 km Eta and 29 km MesoEta out-performed the 10 km MesoEta primarily because of the precipitation overprediction by the 10 km MesoEta
- The 10 km MesoEta "West Nest" has shown, at times, better skill and ability at predicting precipitation in the complex terrain of the western United States. However, because of deficiencies in the precipitating convection schemes used in the Eta models, convective precipitation tends to be overdone. This feature is especially enhanced in the 10 km MesoEta as the horizontal grid resolution was increased.
LOW-LEVEL WIND COMPARISON
Synoptic & Mesoscale Evolution
- 22 February 1997
- 00Z: Long-wave trough over the central United States with a ridge off the West Coast. Short-wave trough over northeast California and northwest Nevada.
- 12Z: Long-wave ridge off West Coast amplifies. Previous short-wave trough dropped to central Nevada with another in southeast Washington and northeast Oregon.
- 23 February 1997
- 00Z: Long-wave ridge off West Coast continues to amplify with long-wave trough broadening from western to wastern United States. Short-wave trough previously in Nevada weakening and moved to northern Arizona. Short-wave trough previously in Washington/Oregon amplified and moved to northwest to west Nevada.
- 12Z: Long-wave ridge off West Coast becoming pinched off near southern British Columbia. Short-wave trough previously in northwest Nevada strengthens as it moves to central California over the Sierra Nevadas. Low center thus apppears to be moving in southwest direction with addditonal short-wave troughs being pulled in from north through Montana. Flow in central and eastern United States more zonal.
- 24 February 1997
- 00Z: Strong short-wave trough over central California with 500mb low center over southern Nevada. Trough axis oriented southwest to northeast across Salt Lake City.
- 12Z: Upper-level low is now closed over southern Nevada with two short-wave troughs rotating around. One is approaching southern Arizona from the west, while the other is in northern Nevada approaching from ENE.
Observed Surface Winds
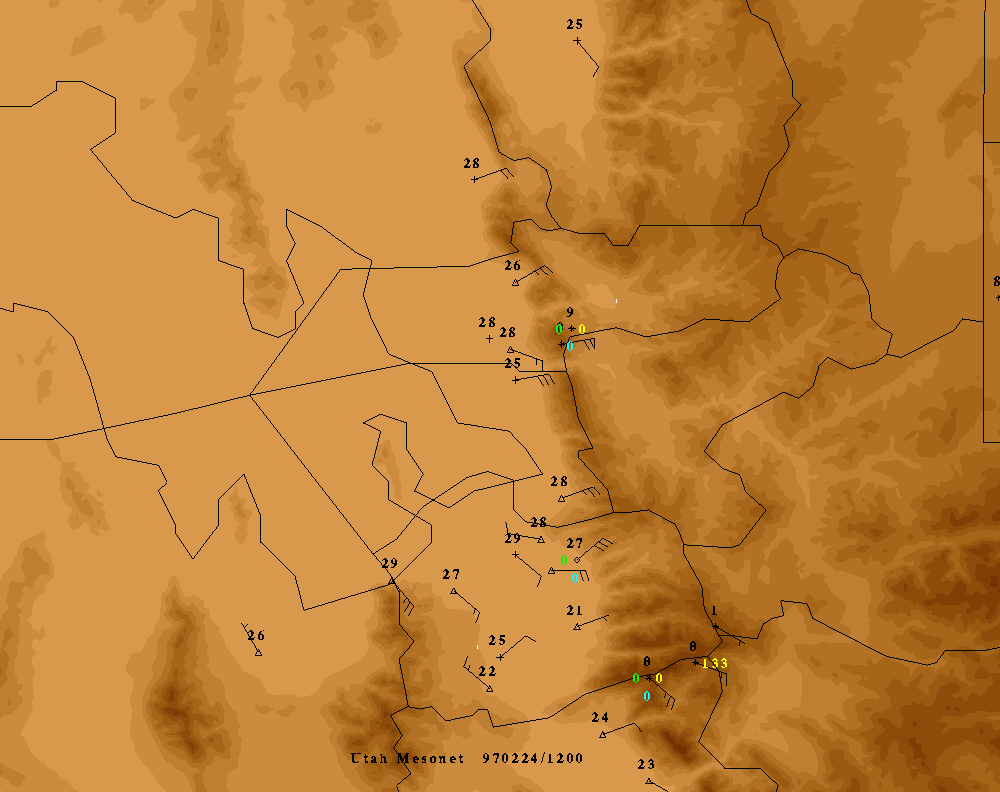
- The observed winds used for verification in this study come from the data set compiled by the Utah Mesonet Project
- Max wind gusts reported: (from NWSFO)
- Mount Ogden - 93 MPH
- Centerville - 77 MPH
- Bountiful - 65 MPH
- Ogden Bench - 64 MPH
- Hill Air Force Base - 59 MPH
- University of Utah - 53 MPH @ 6:25 AM
- Brigham City - 51 MPH
Observed Surface Winds Images
Utah Mesonet surface winds on 24 February 1997 at 1200 UTC
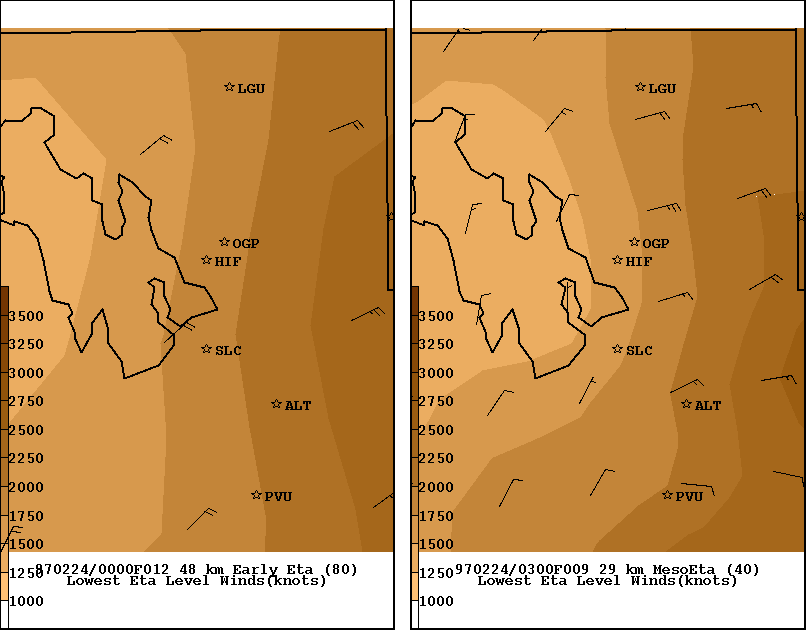
Model Surface Wind Forecasts for 1200 UTC on 24 Feb 1997
Left: 48 km Eta lowest eta level winds (80km grid)
Right: 29 km MesoEta lowest eta level winds (40km grid)
Left: 10 km MesoEta lowest eta level winds
Right: 6 km non-hydrostatic MM5 9950 sigma level winds
Model Cross-Sections for 1200 UTC on 24 Feb 1997
Top: 10 km MesoEta THTA(contours), OMEGA(shades), & OBS(knots)
Bottom: 6 km MM5 THTA(contours), WWND(shades), & OBS(knots)
Windstorm Summary
- Observed downslope winds in the western foothills of the Wasatch Front ewere between 20 to 40 knots with gusts as high as 70 knots in some locations. Crest level winds on Mount Ogden were sustained at 50-70 knots for much of the period with gusts reaching 80 knots (93 mph).
- Surface Winds:
- Maximum wind speeds indicated by the 48 km Eta at 1200 UTC on 24 feb 1997 were around 20 knots - on the low side.
- The 29 km MesoEta forecasted surface winds of 25 knots north of the Ogden area but only 15 knots southward - on the low side. The 29 km MesoEta does show winds becoming northerly on the western side of the Wasatch Front.
- Similar to the MesoEta, the 10 km MesoEta forecasted surface winds of around 20 knots - on the low side. The 10 km MesoEta shows much detail over the Great Salt Lake Basin in the northlery flow.
- The 6 km MM5 forecasted 50 knot surface winds between Salt Lake City and Ogden - quite a good forecast. However, the strong easterly flow is extended out over the Great Salt Lake where the flow should be northerly.
- Cross-Section:
- The 10 km MesoEta shows good packing of the theta lines but fails to produce a 'vertical theta trough' to the west of the mountains. The vertical velocity structure seems quite reasonable. The terrain of the 10 km MesoEta is also more realistic.
- The 6 km MM5 forecasts strong winds in the area of tightest packing of the thta lines above the terrain to the east of the crest. The terrain is not as realistic. The vertical velocity structure is quite good.
- For more information and graphics. please refer to the 24 February 1997 Downslope Windstorm Web page
Please direct comments to Brett McDonald
Updated Thursday 01 October 1997


 Click Here to see the same graph except for the GD method
 Click Here to see the same graph except for the GD method
 Click Here to see the same graph except for the GD method
 Click Here to see the same graph except for the GD method
 Click Here to see the same graph except for the GD method
 Click Here to see the same graph except for the GD method
 Click Here to see the same graph except for the GD method
 Click Here to see the same graph except for the GD method
 Click Here to see the same graph except for the GD method


